
What we keep seeing in checkout audits is this: teams talk about conversion loss as if it starts in paid media, when a large share of the leak actually appears after the shopper has already done the hard part. They found the product. They added to cart. Then the checkout experience asked for too much effort or too little trust.
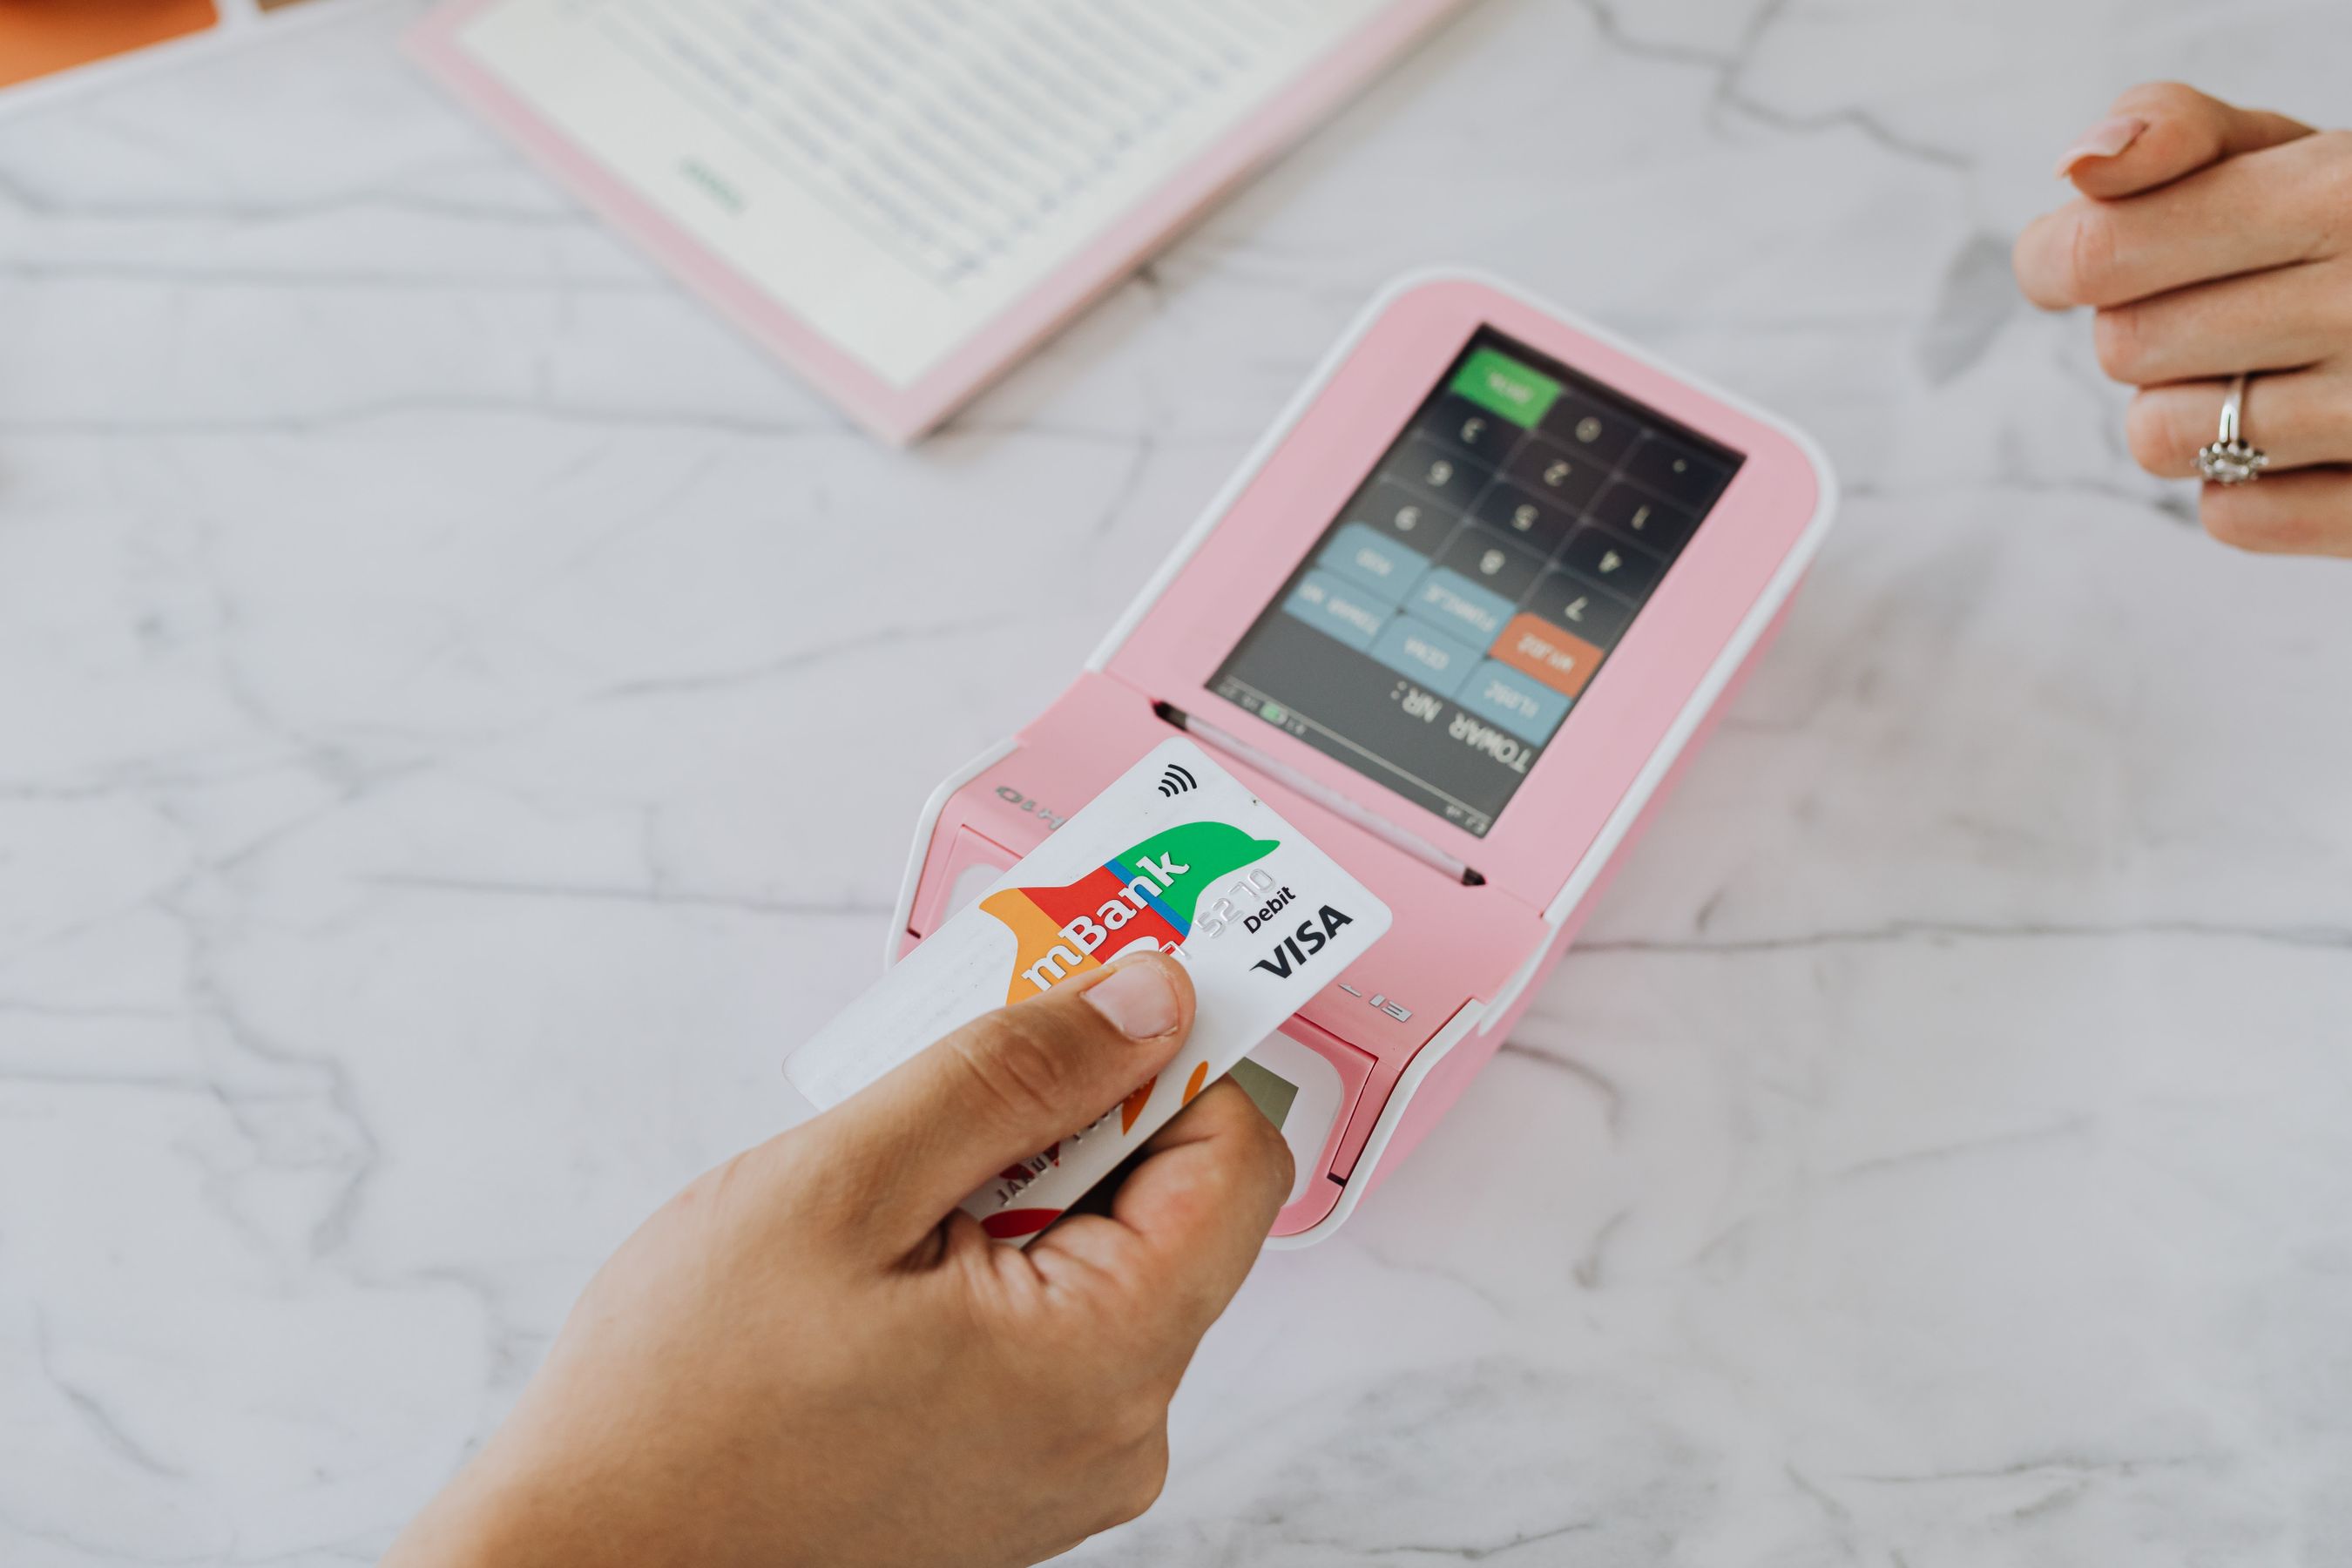
Table of Contents
- Keyword decision and intent framing
- The current checkout statistics that matter
- Why abandonment is still structurally high
- Checkout benchmark table
- Payment-method fit versus payment-method count
- Anonymous operator example
- Execution checklist
- Sources and references
Keyword decision and intent framing
- Primary keyword: ecommerce checkout statistics
- Secondary intents: cart abandonment statistics, digital wallet conversion, local payment methods ecommerce
- Search intent: informational with strong commercial application
- Funnel stage: mid to late
- Why this angle is winnable: many checkout articles stop at abandonment headlines and do not connect them to wallet speed, local relevance, or payment presentation logic.
For broader funnel context, read Ecommerce Conversion Benchmarks by Funnel Stage, Device, and Checkout Friction (2026) and Ecommerce Checkout Performance Analytics: Wallets, Risk, and Fallback Recovery (2026).
The current checkout statistics that matter
Baymard’s updated checkout research still provides the clearest macro warning: the average cart abandonment rate currently sits at 70.19%. That figure is so familiar that many operators have become numb to it, but it should still be treated as a live profitability signal.
Stripe’s 2026 checkout trends sharpen the picture:
- 65% of transactions under $50 now happen on mobile
- digital wallets cut average mobile checkout time in half
- 61% of surveyed shoppers said they would use a digital wallet
- showing one payment method that is not geographically relevant can reduce conversion by up to 15%
- offering BLIK in Poland improved checkout conversion by 46% on average in Stripe’s data
- offering Pix in Brazil improved checkout conversion by 31% on average
This changes the checkout conversation. The issue is not simply “make checkout shorter.” The issue is “make checkout feel locally normal, fast, and low-risk.”
Why abandonment is still structurally high
Abandonment persists because many teams optimize the wrong layer.
They focus on:
- headline page speed
- top-of-funnel design polish
- average conversion rate
But shoppers abandon at the point where:
- the payment choice feels unfamiliar
- form effort spikes on mobile
- total cost or trust is unclear
- an error, retry, or authentication step feels unsafe
Baymard’s long-running work is still useful because it reminds teams that this is rarely one issue. Stripe’s newer data adds the payment-localization layer that many older checkout guides missed.
Need a checkout diagnosis that maps abandonment to payment mix and device behavior? Contact EcomToolkit.
Checkout benchmark table
| Statistic | Current public signal | What operators should do |
|---|---|---|
| Average cart abandonment | 70.19% according to Baymard’s 2025 update | treat checkout friction as a major revenue control system |
| Mobile low-ticket transactions | 65% of transactions under $50 happen on mobile on Stripe data | design checkout for phone-first completion, not desktop fallback |
| Digital wallet willingness | 61% of shoppers in Stripe’s survey would use a wallet | make wallet eligibility and placement visible early |
| Mobile wallet speed impact | wallets cut average mobile checkout time in half | use wallets to reduce form burden, not as a decorative add-on |
| Wrong payment method relevance | one geographically irrelevant method can lower conversion up to 15% | localize method mix by market |
| Market-specific upside | BLIK +46% in Poland, Pix +31% in Brazil on Stripe averages | prioritize dominant methods, not just broad method count |
Payment-method fit versus payment-method count
One of the more common mistakes in international ecommerce is to treat payment breadth as the same thing as payment quality.
They are not the same.
| Approach | Likely result |
|---|---|
| add every available method | clutter, weaker trust, decision fatigue |
| show only familiar local and high-likelihood methods | faster decision path, stronger confidence |
| push card entry above wallets on mobile | more manual effort and slower completion |
| order methods by market logic and device context | better conversion efficiency |
Stripe’s market examples make this concrete. In some countries, simply supporting wallets broadly may be enough. In others, the real lift comes from offering the dominant local method and presenting it in a way that feels native.
That is why checkout optimization should be segmented by:
- market
- device
- order value band
- new versus returning visitor
If you do not segment those variables, checkout “best practices” turn into guesswork.

Anonymous operator example
A cross-border merchant had acceptable cart creation rates but unstable checkout completion in EMEA. The internal narrative was that buyers were price-sensitive and international demand was unreliable.
The checkout review showed a different pattern:
- mobile checkout dominated the affected cohort
- the most visible payment option was not the most locally expected one
- wallet options existed but were presented too low in the flow
- failed attempts rose when shoppers had to re-enter details after address validation
The fix was not a redesign of the whole checkout stack. It was a relevance redesign:
- reorder methods by geography
- increase wallet prominence on eligible devices
- remove non-essential friction between cart and payment authorization
The store did not need more payment methods. It needed better payment fit.
Execution checklist
| Control area | Pass condition | Risk signal |
|---|---|---|
| Method relevance | dominant local methods are present and prominent | card-heavy flow in wallet-led or local-method-led markets |
| Mobile effort | most high-intent paths can complete with minimal typing | address and card fields dominate abandonment |
| Wallet visibility | wallets are surfaced early on supported devices | express methods are technically enabled but commercially hidden |
| Error recovery | shoppers can recover without losing confidence | silent failures, vague declines, or forced restarts |
| Market segmentation | checkout reporting is broken down by market and device | one blended abandonment rate hides root causes |
What matters most now
The hardest part of checkout improvement in 2026 is not discovering that abandonment exists. Everyone already knows that. The hard part is admitting that many checkout flows are still designed around merchant convenience instead of shopper confidence.
EcomToolkit’s point of view is straightforward: if your checkout review does not include wallet visibility, local payment fit, mobile effort, and error recovery, it is not a real checkout review. It is just UI commentary.
If you want a revenue-focused checkout action plan rather than another generic CRO checklist, Contact EcomToolkit.

